The Migration Policy Centre, in the framework of the FAO Project “Youth Mobility, Food Security and Poverty Reduction: Fostering Rural Diversification Through Enhanced Youth Employment and Better Labour Mobility”, carried out a research study on youth rural migration in Tunisia, its determinants and its impact on food security and rural livelihoods in regions of origin. The project was funded by the Italian Agency for Development and Cooperation and implemented in collaboration with the Agence pour la Promotion des Investissements Agricoles (APIA) in Tunisia.
OBJECTIVES OF THE STUDY
- – To develop and test a sound methodology to analyse the rural migration of youth, with special attention to the drivers of migration and mobility;
- – To examine the diversity of rural youth migration patterns, and the types of movement and its impacts on household and individual food security and livelihoods, as well as labour dynamics in the areas of origin in Tunisia;
- – To provide policy recommendations, in particular concerning interventions to increase opportunities for youth in agro-related activities as an alternative to distress migration;
RESEARCH PLAN
The research used a mix of quantitative and qualitative methods in four stages:
- – Review of literature and statistical mapping.
- – Statistical analysis of the correlates of rural migration.
- – Qualitative research. In parallel to the survey, and on the basis of the key issues identified in phases 1 and 2, a set of structured interviews were conducted with key informants and a number of focus groups within each of the communities analyzed (the same as for the survey). Participatory Rural Appraisal techniques were applied.
- – Rural Migration Survey. An ad hoc quantitative migration survey were designed to describe and interpret the individual and household characteristics that underlie the decision to migrate from rural areas, as well as the impact of youth rural urban migration on household and individual food security and livelihoods, and the labour dynamics in the areas of origin. Its target population is composed of migrants (individuals and households), with non-migrants (individuals and households) used as a control group. Accordingly, the survey was conducted both at destination (households with migrants) and origin (households with and without migrants).
Project Brief
Fiche de projet (en français)
ACTIVITIES
Survey workshop in Jendouba, 14 December 2016
Survey workshop in Tunis, 15 December 2016
Final Workshop – Youth mobility, food security and rural poverty reduction (RYM), 19 February 2018, FAO, Rome
FINAL STUDY
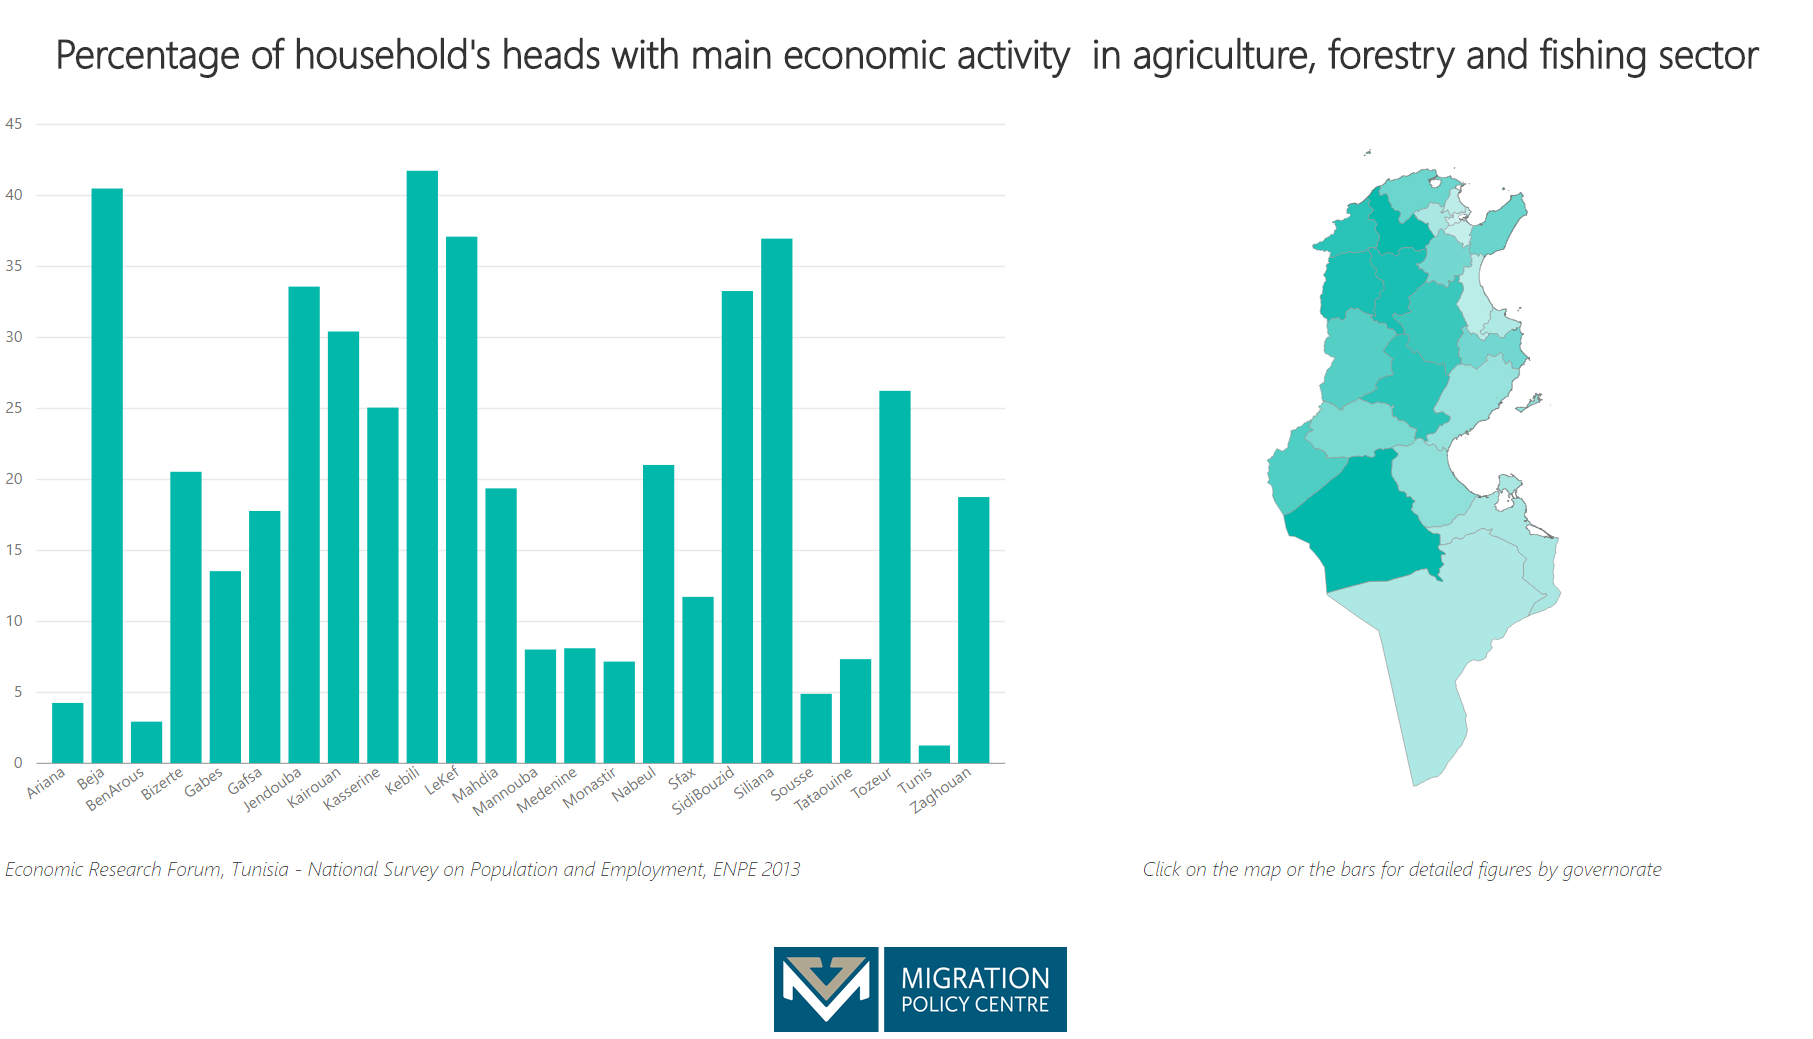
STATISTICAL MAPPING
List of key variables by governorates
– Internal emigration (inter-governorate) 2009-2014 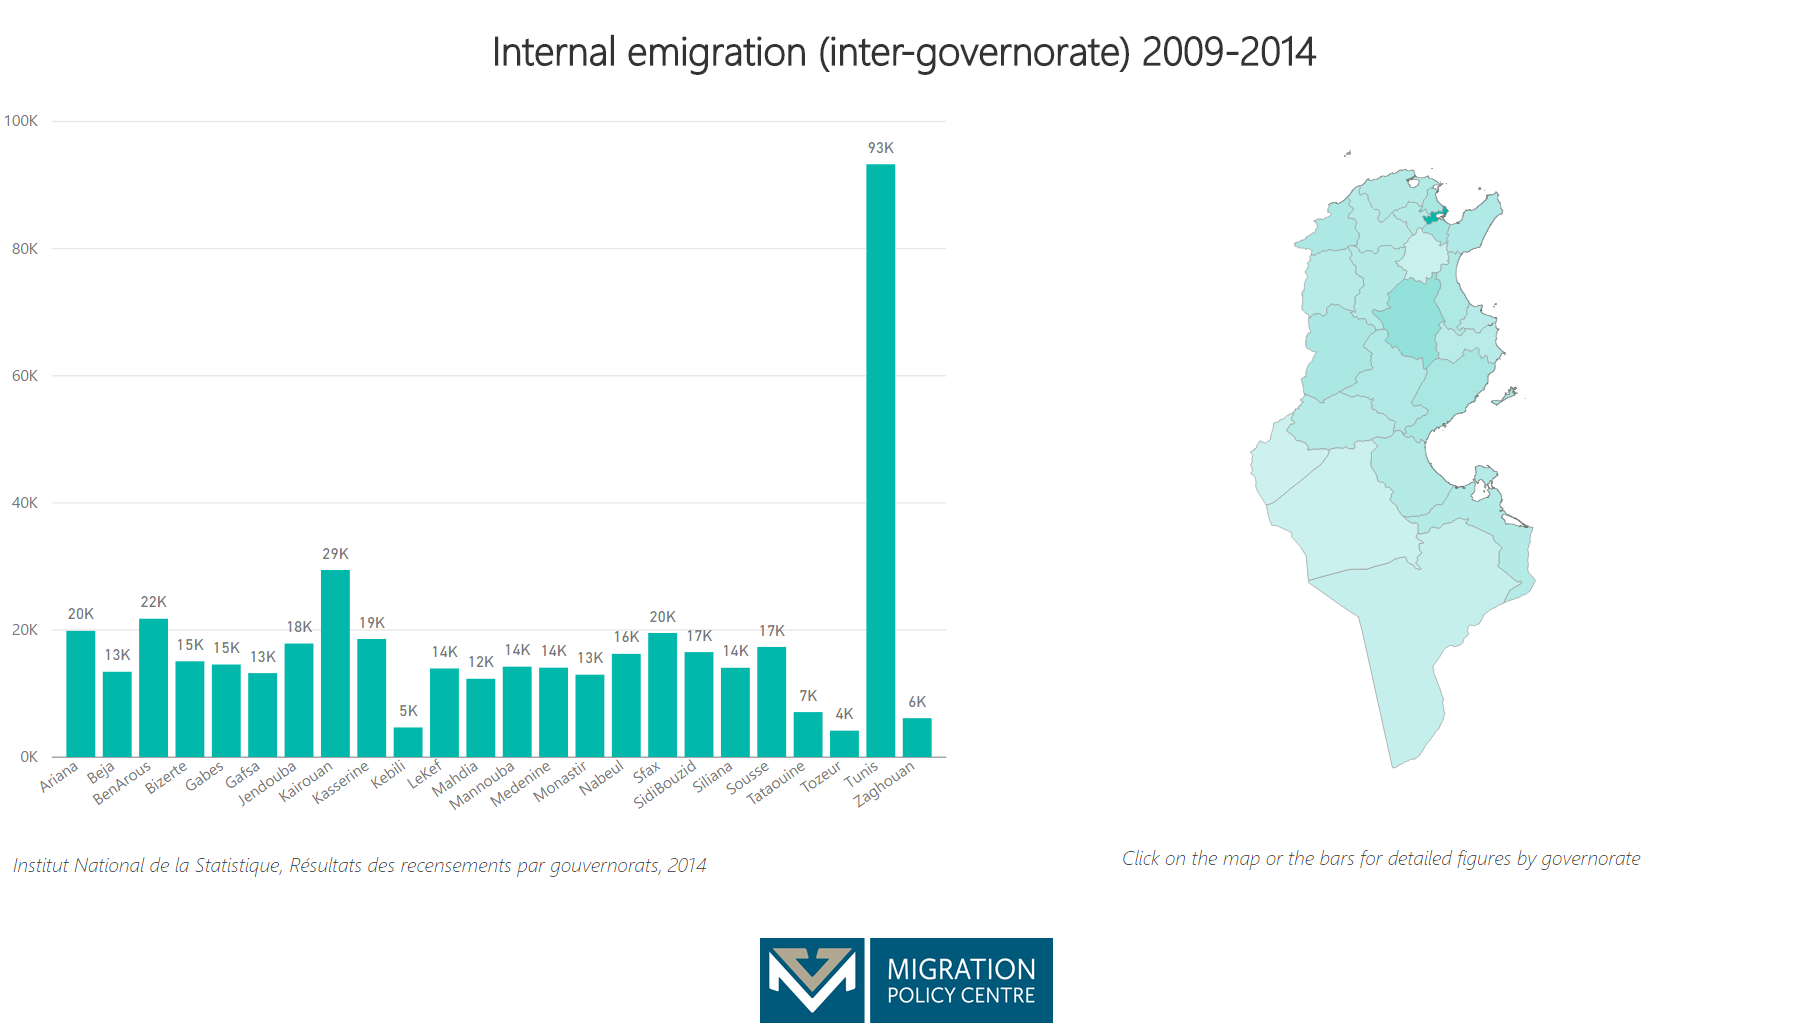
– Internal emigration (inter-governorate) 2004-2009 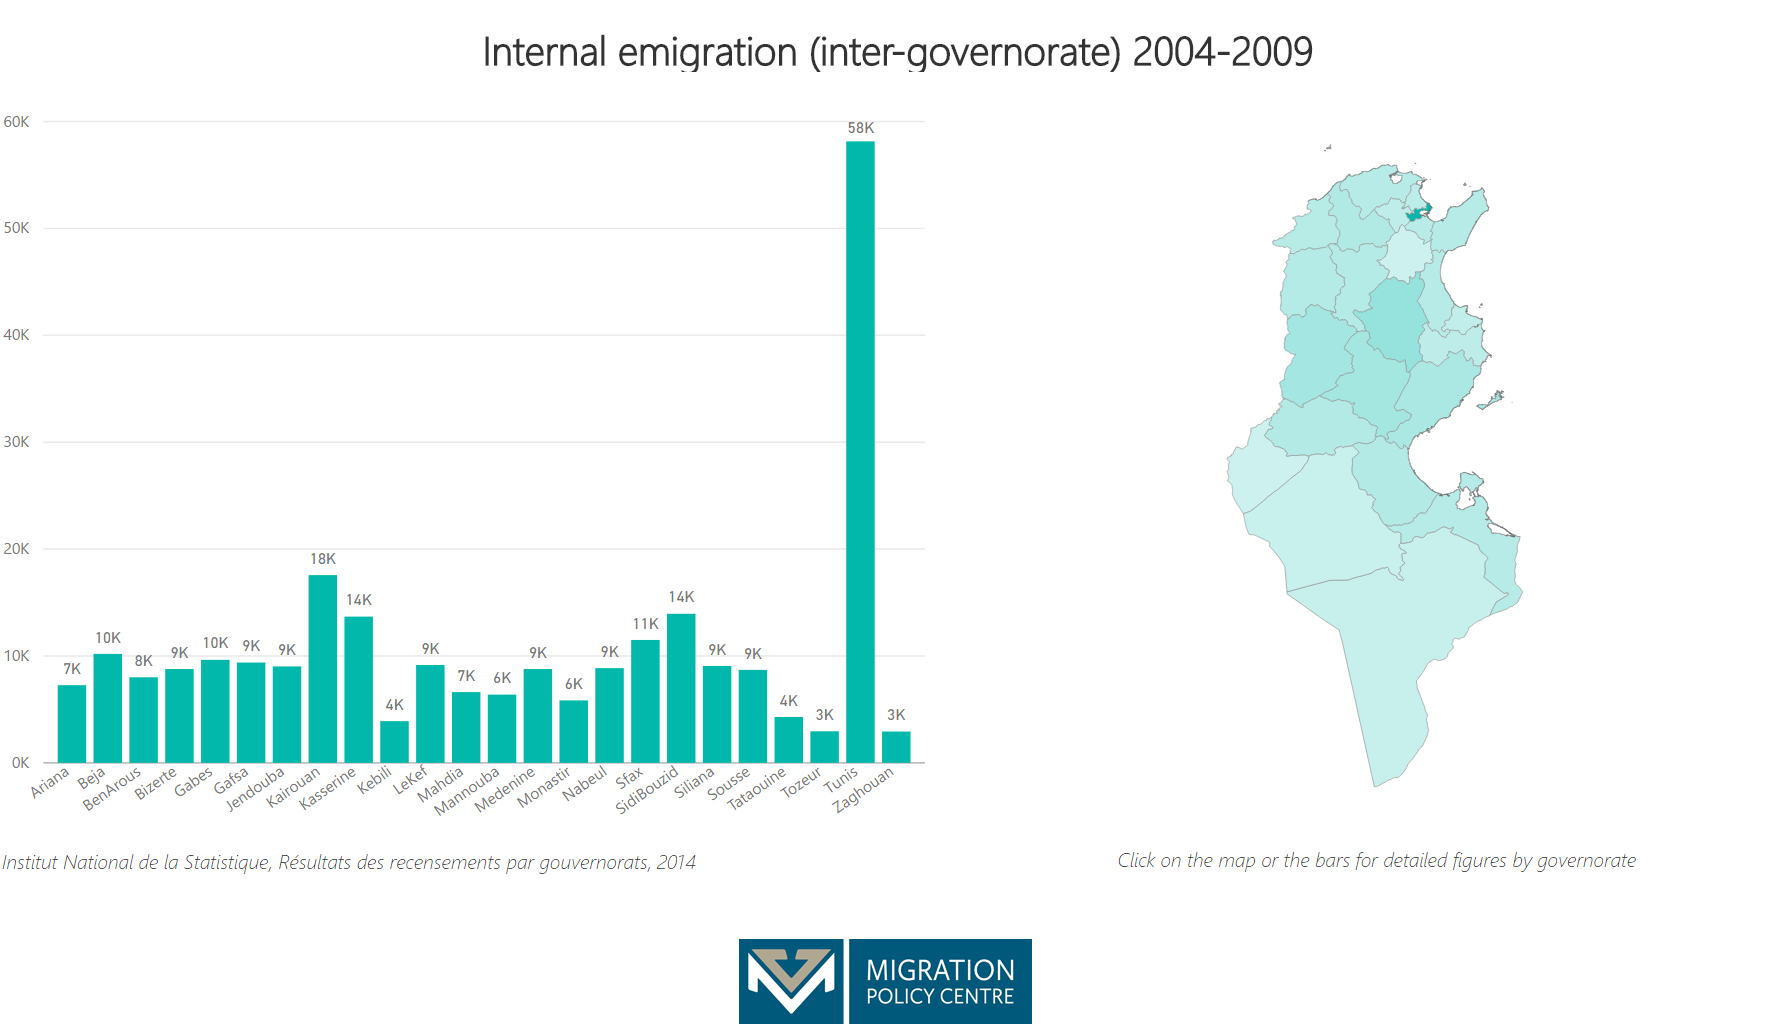
– Percentage of internal emigration over total population 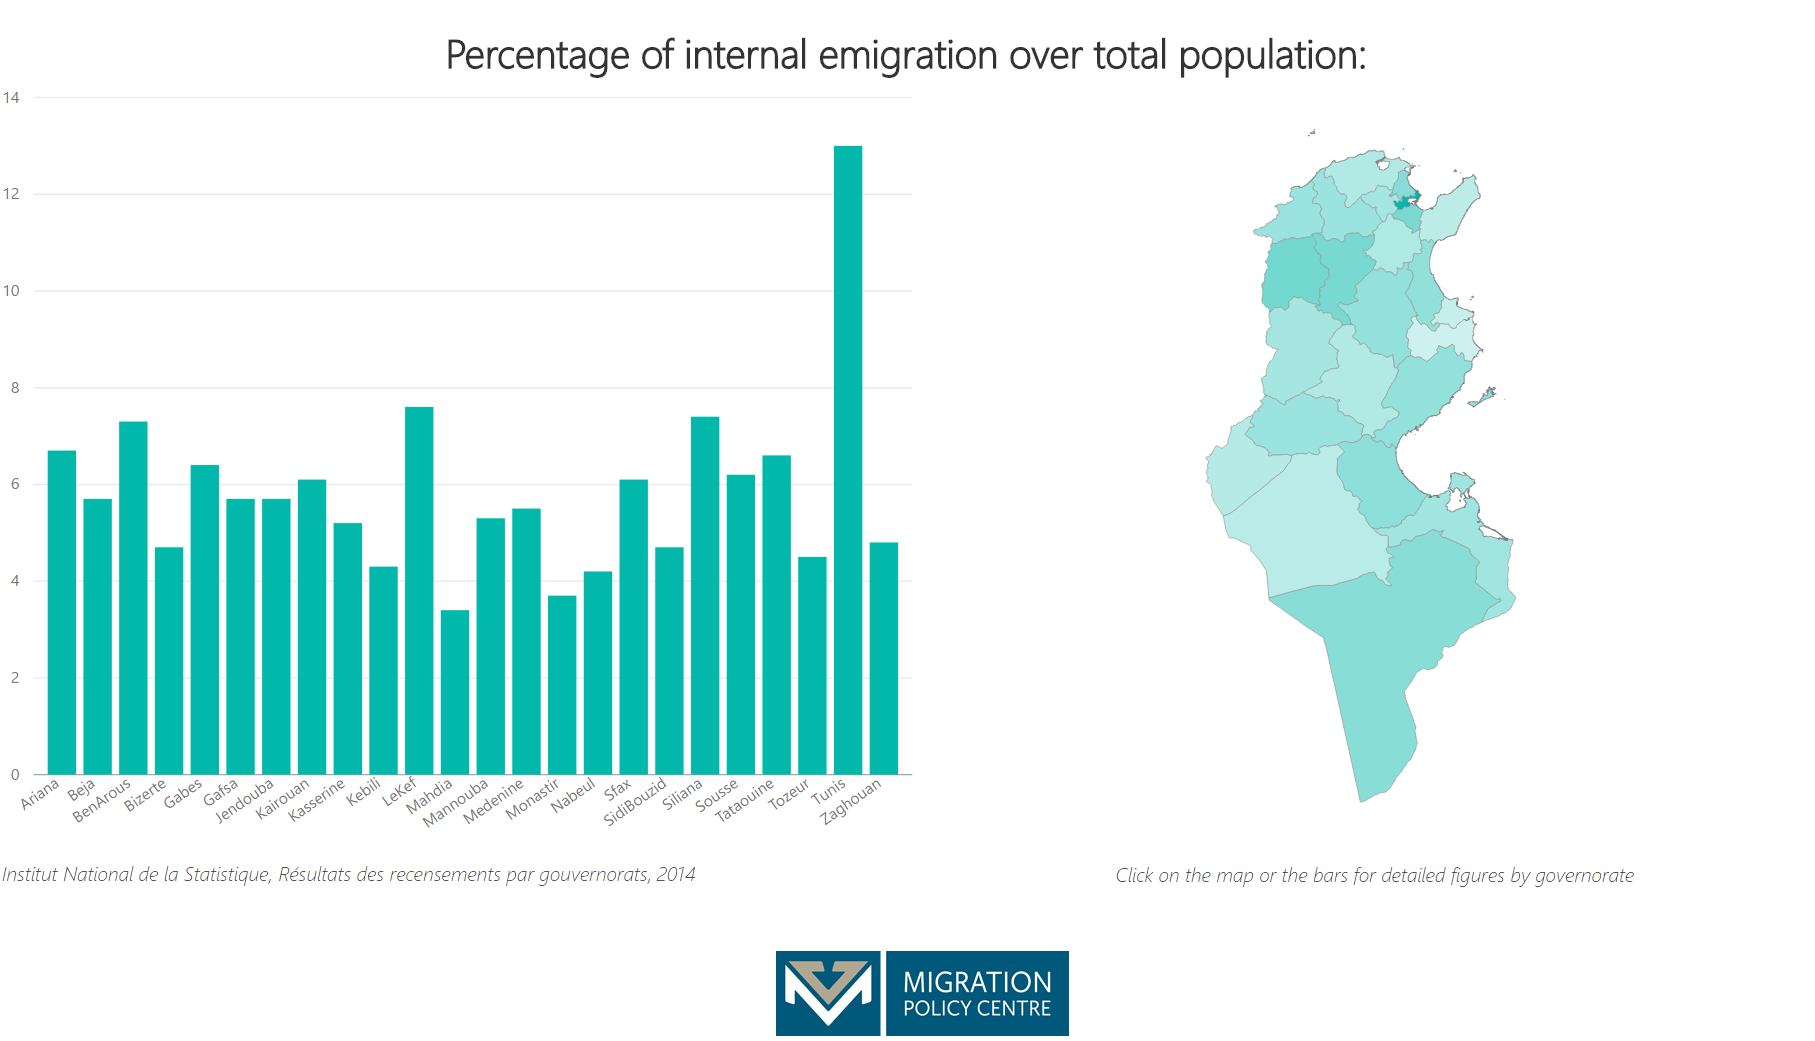
– Percentage of external emigration over total population 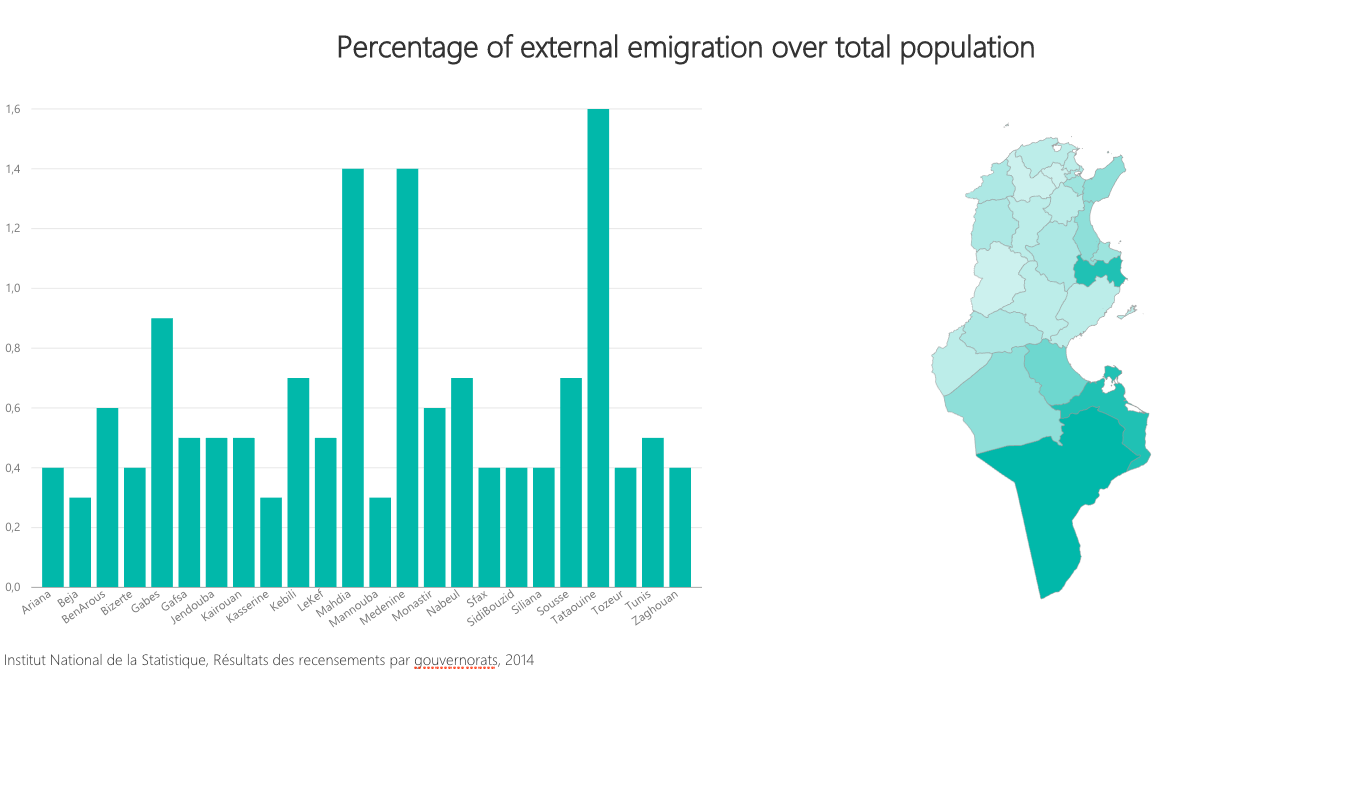
– Net Internal Migration Rate (IMM-EMI Interne/POP)*100 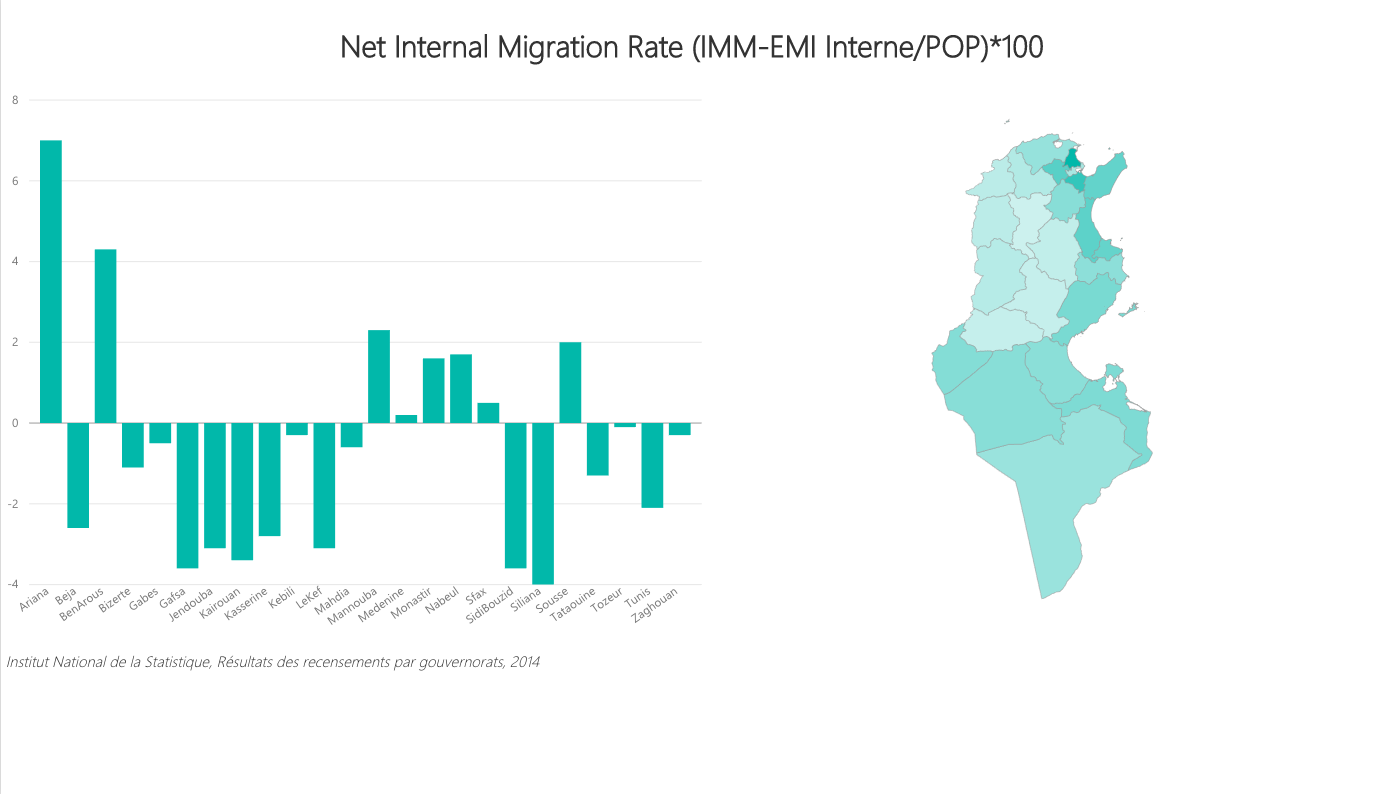
– Percentage of population between 20 and 29 years old 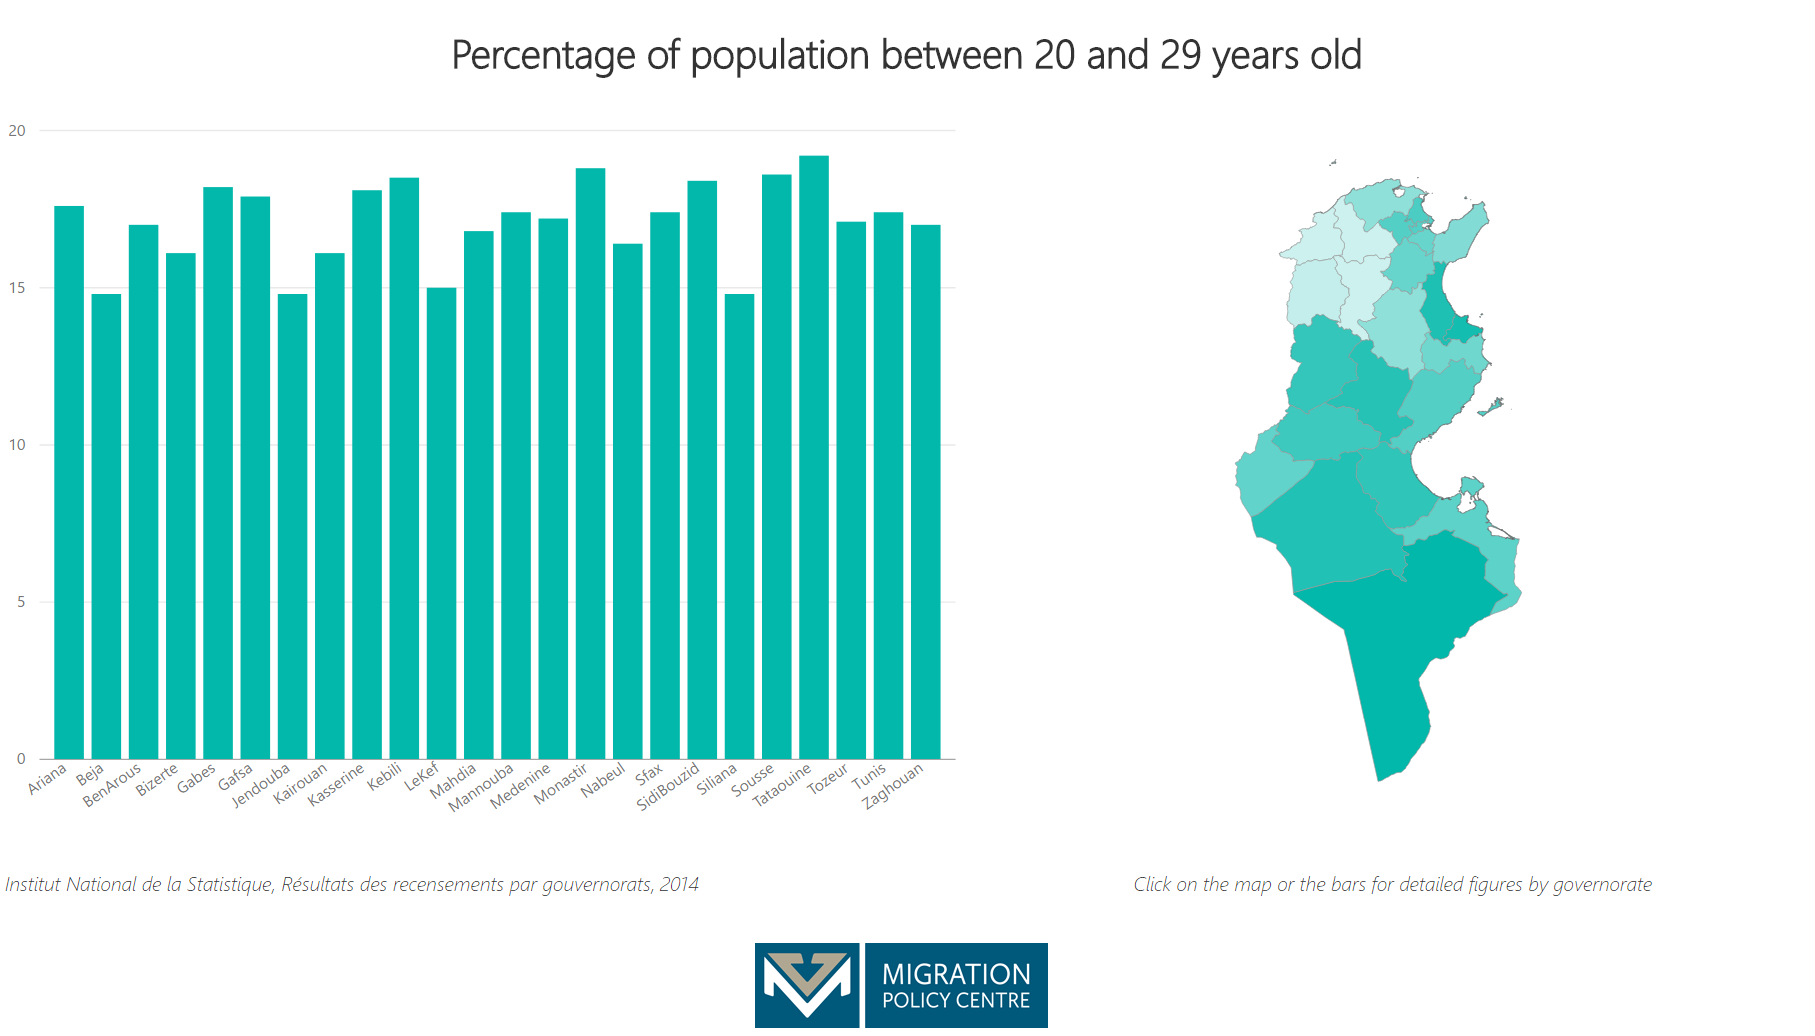
– Percentage of population older than 15 years
employed in the agriculture, and fishing sector 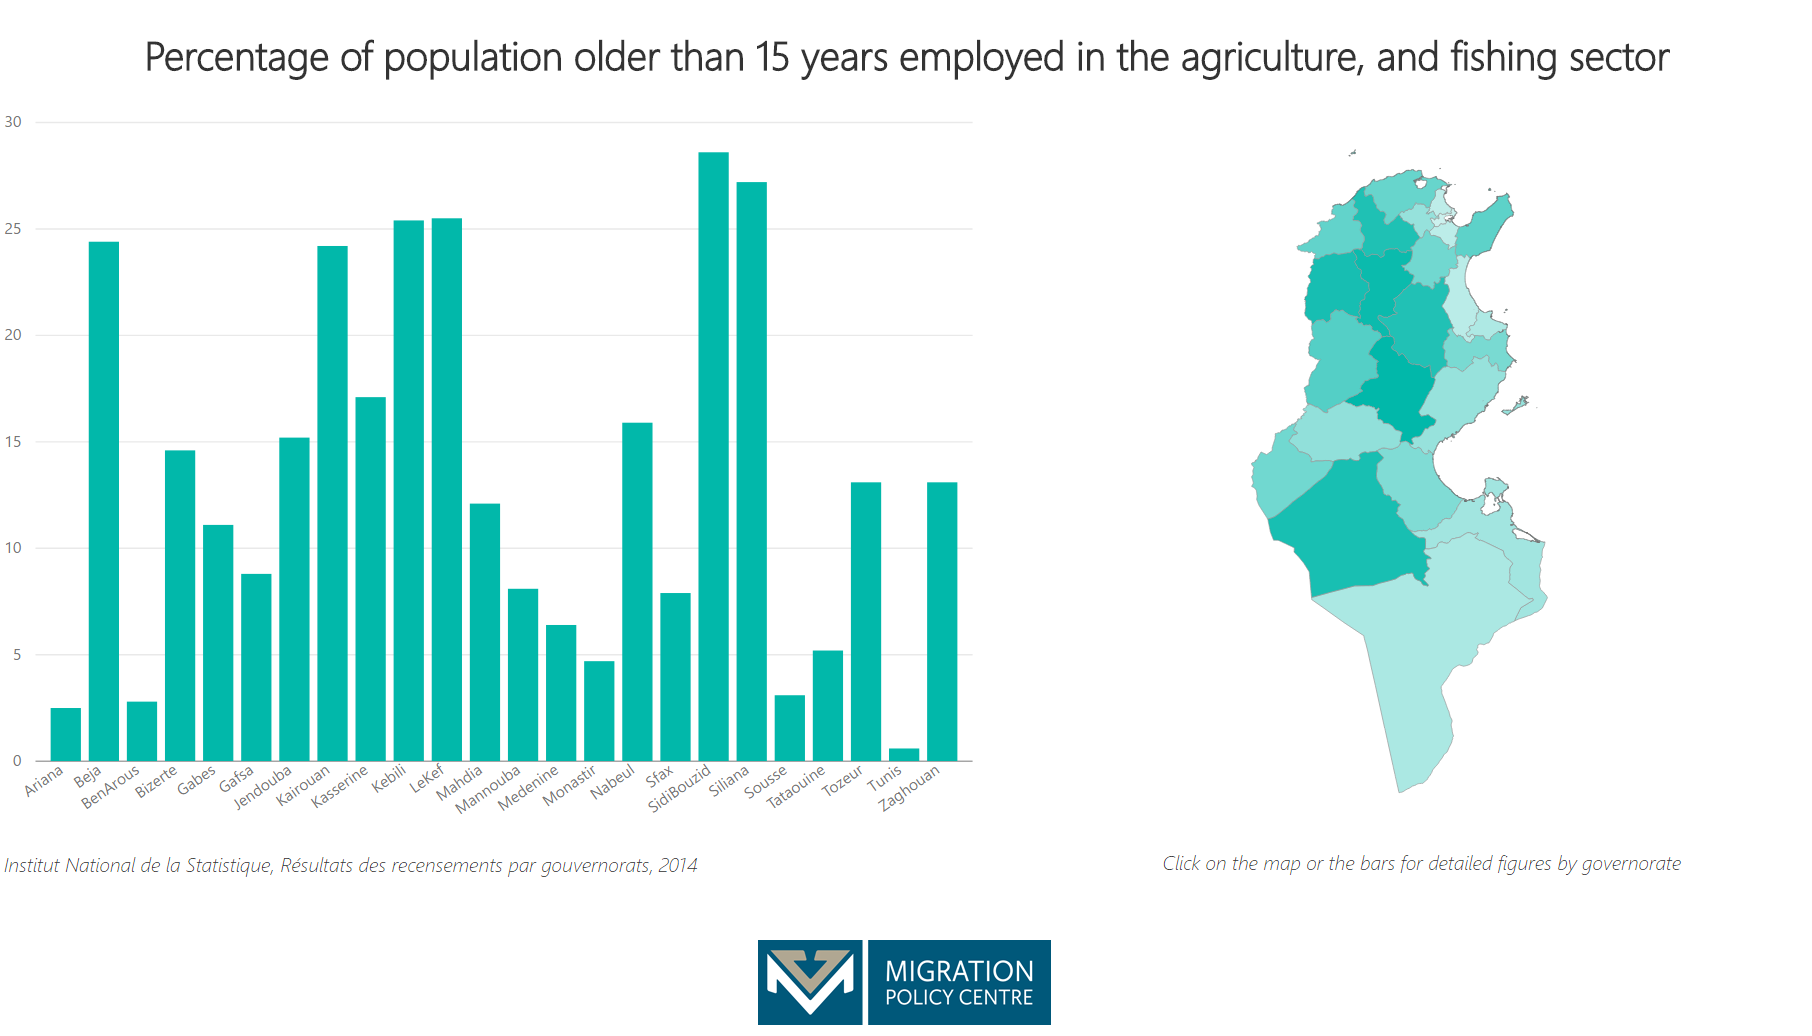
– General Regional Development Indicator (IDR) 2011 %202011.png)
– Thematic Regional Development Indicator: Knowledge Index 2011 
– Thematic Regional Development Indicator: Wealth and Employment Index 2011 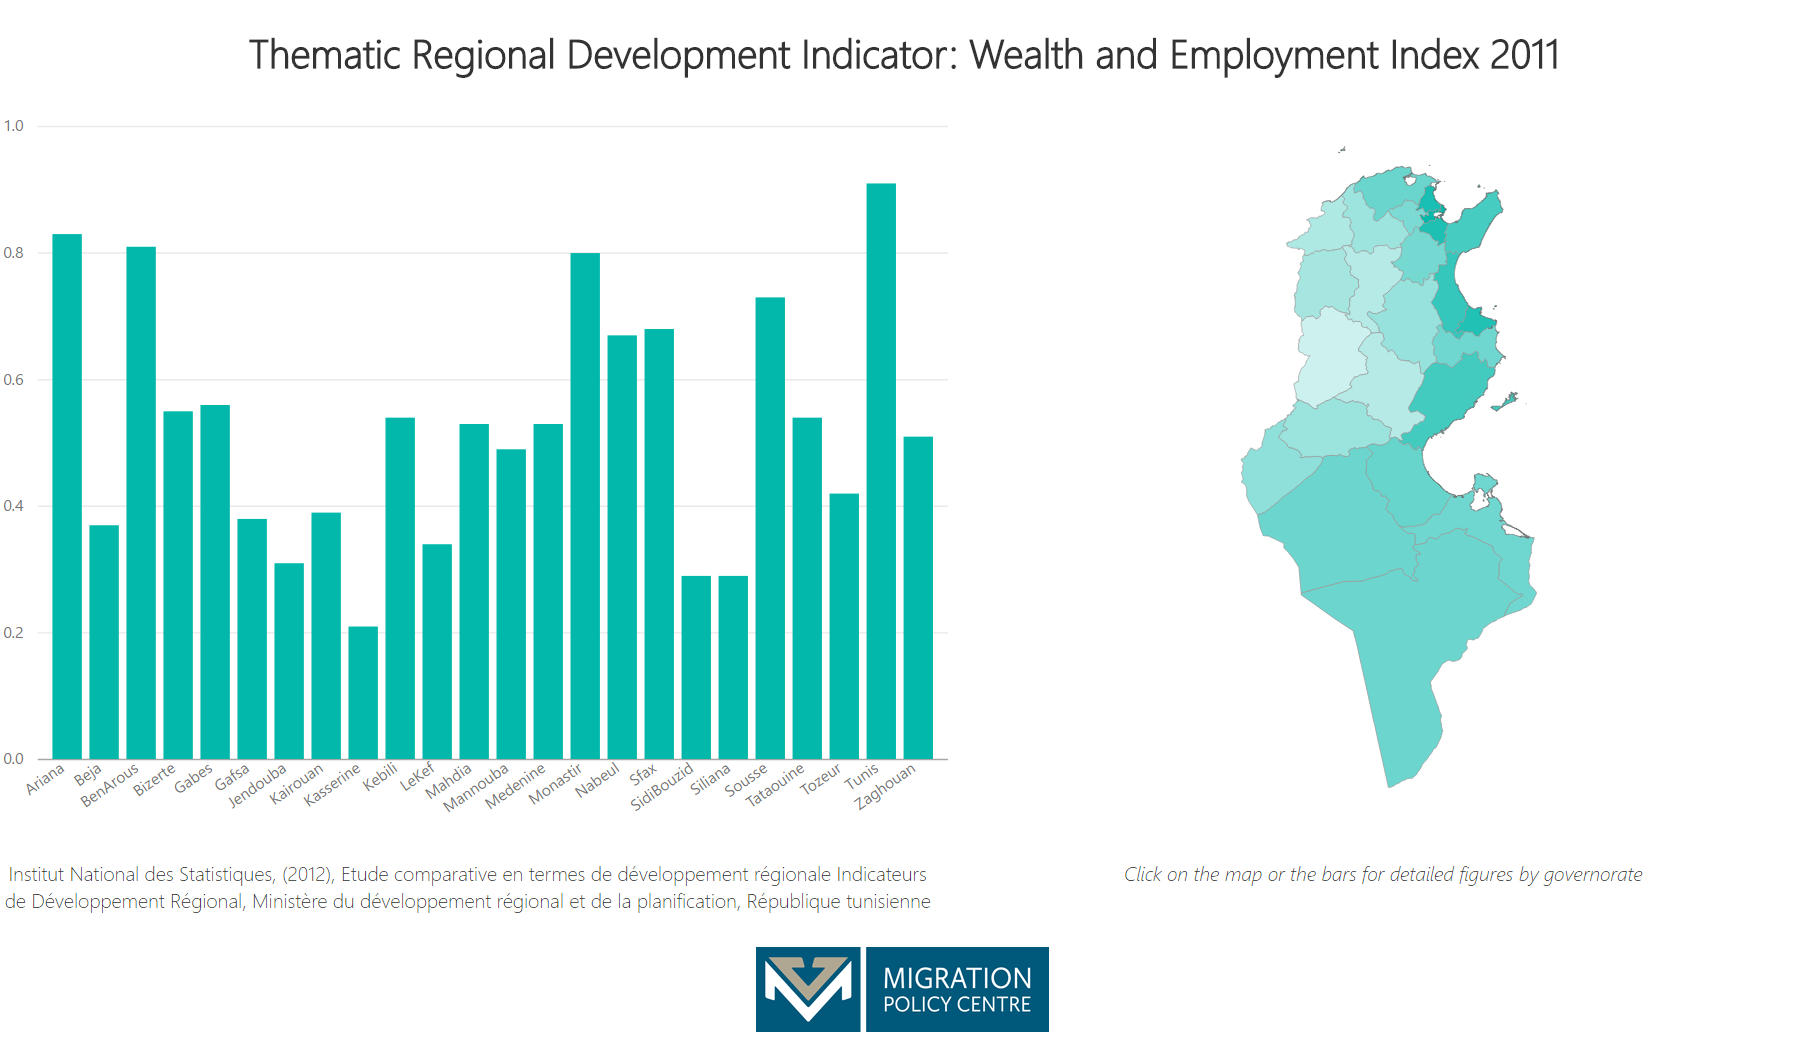
– Thematic Regional Development Indicator: Health and Population Index 2011
– Thematic Regional Development Indicator: Justice and Equity Index 2011 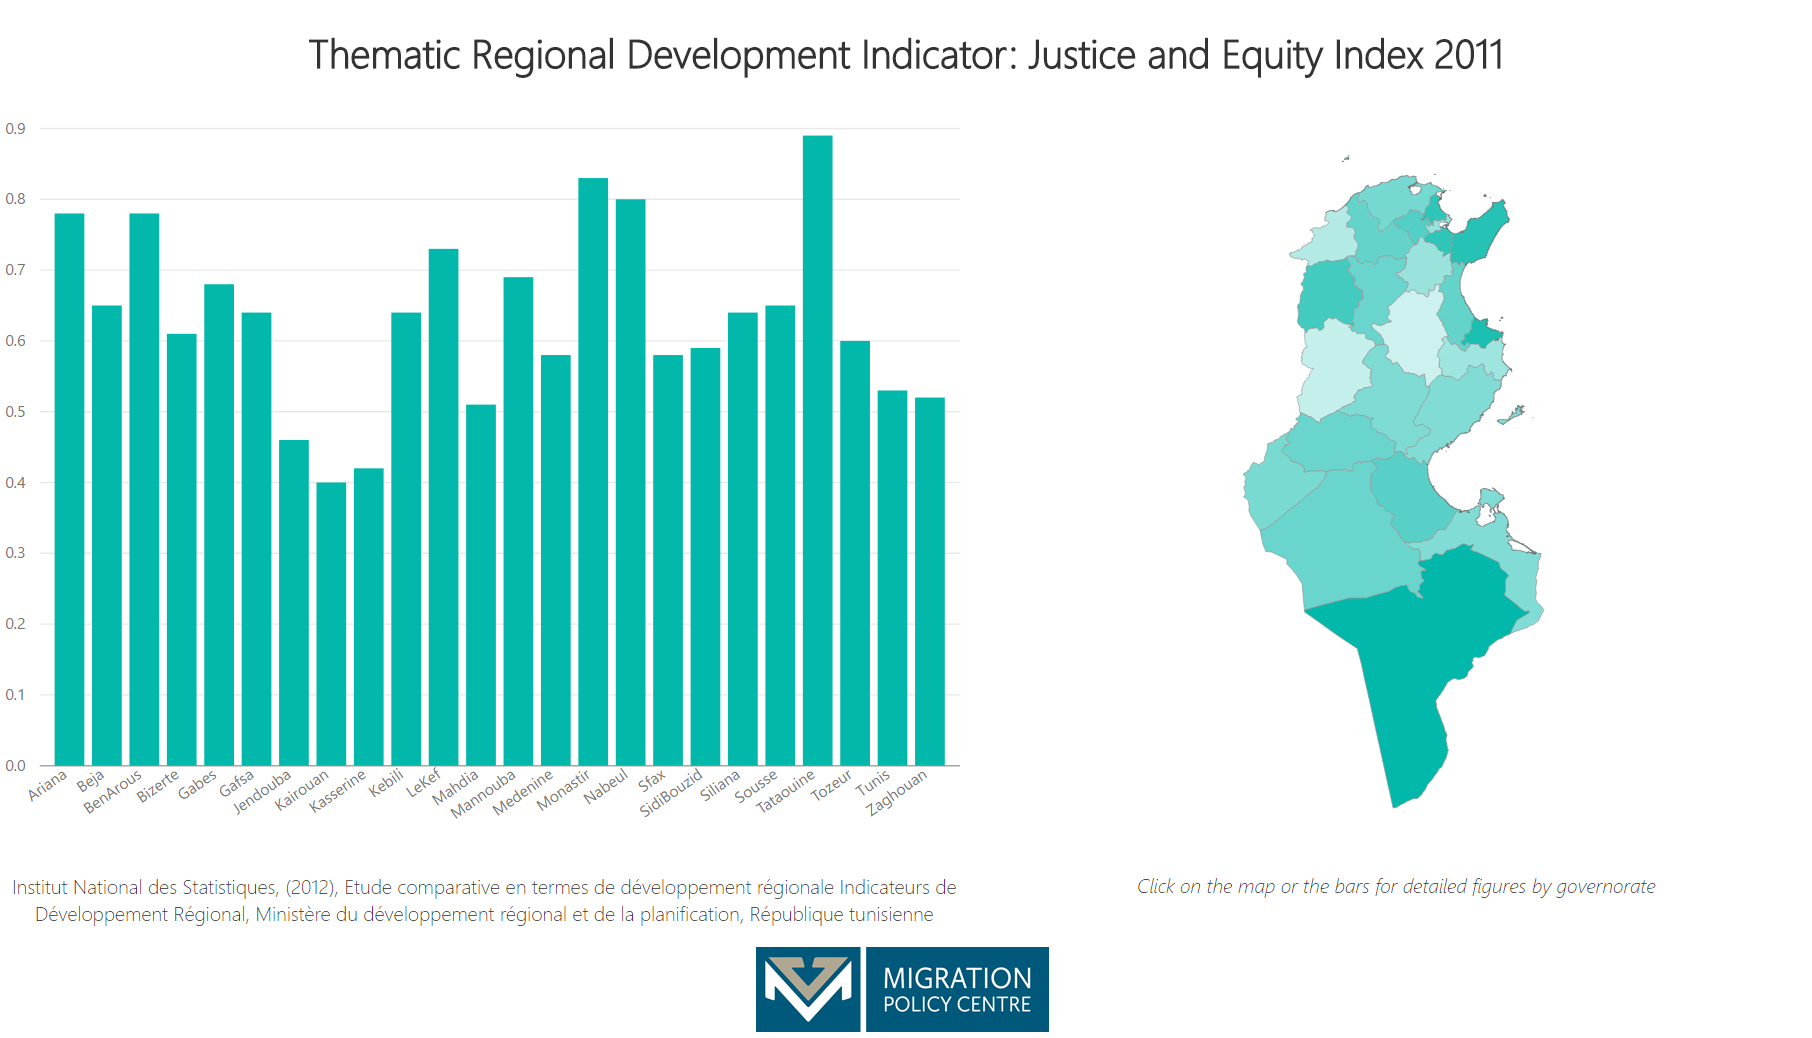
– Percentage of population with no education 
– Percentage of male population with no education 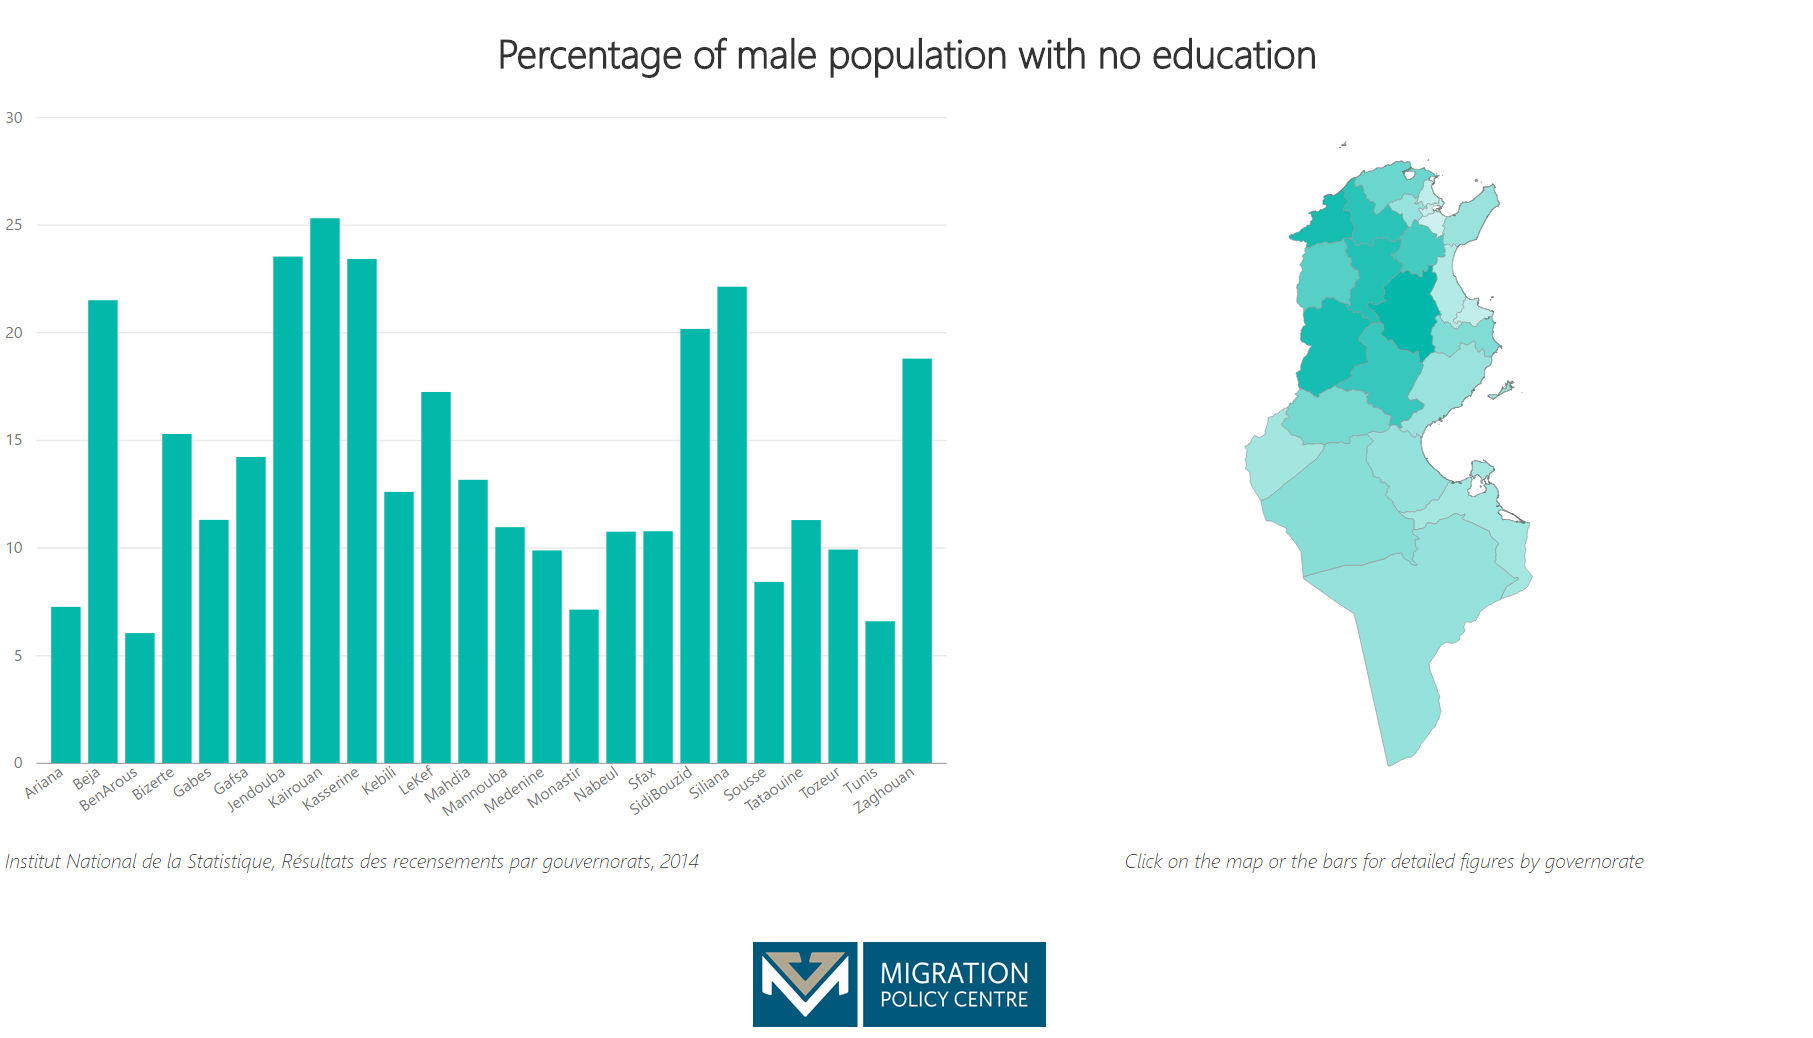
– Percentage of female population with no education 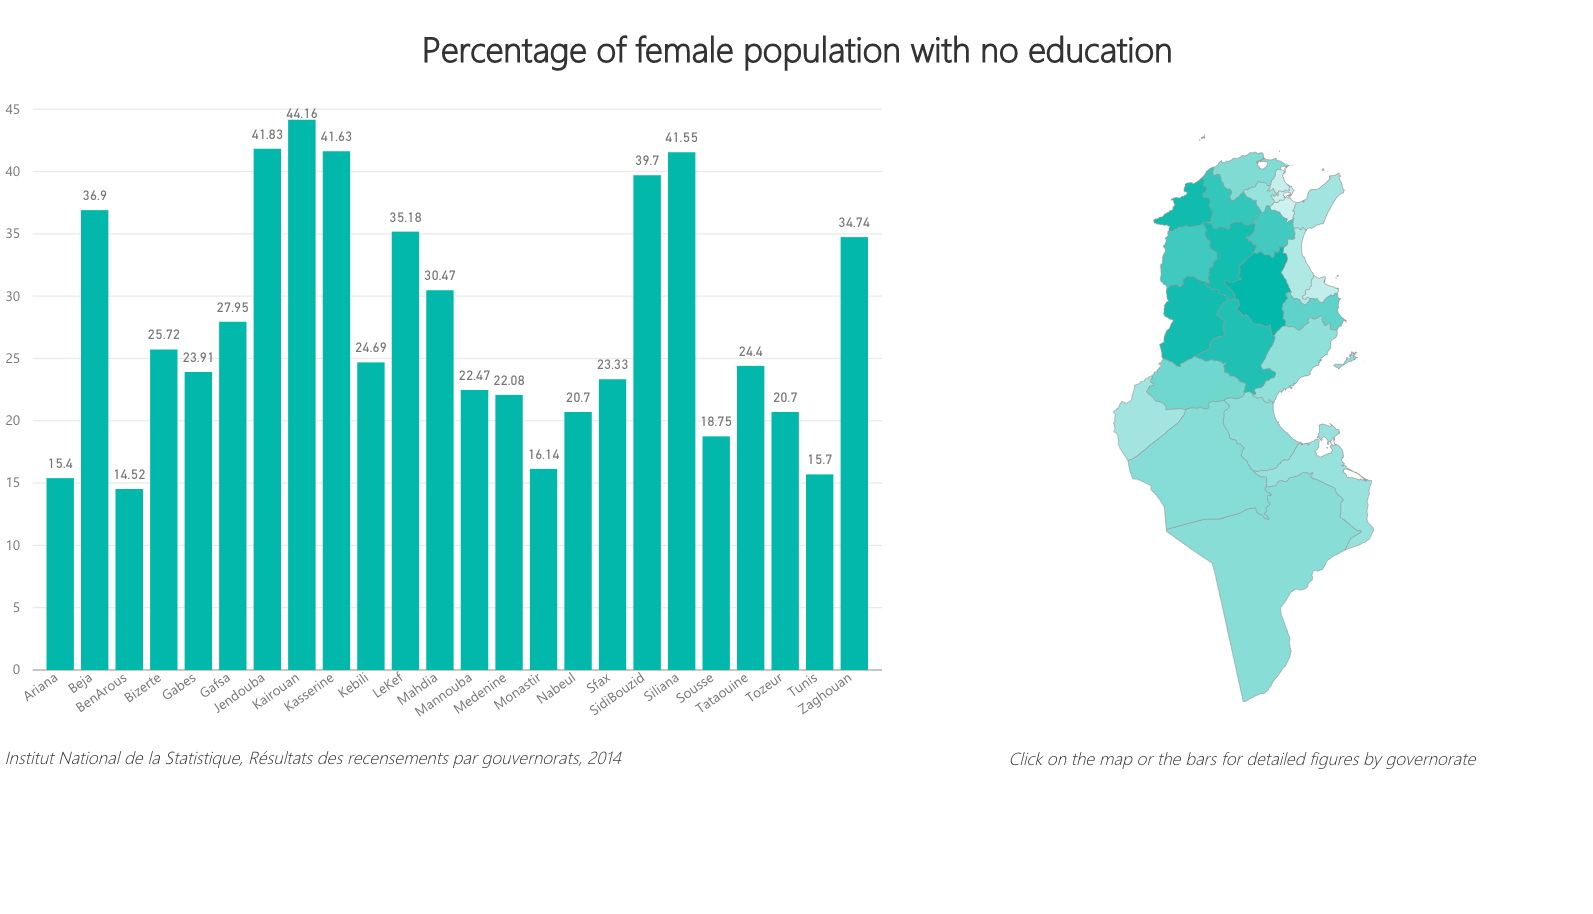
– Percentage of population with tertiary education 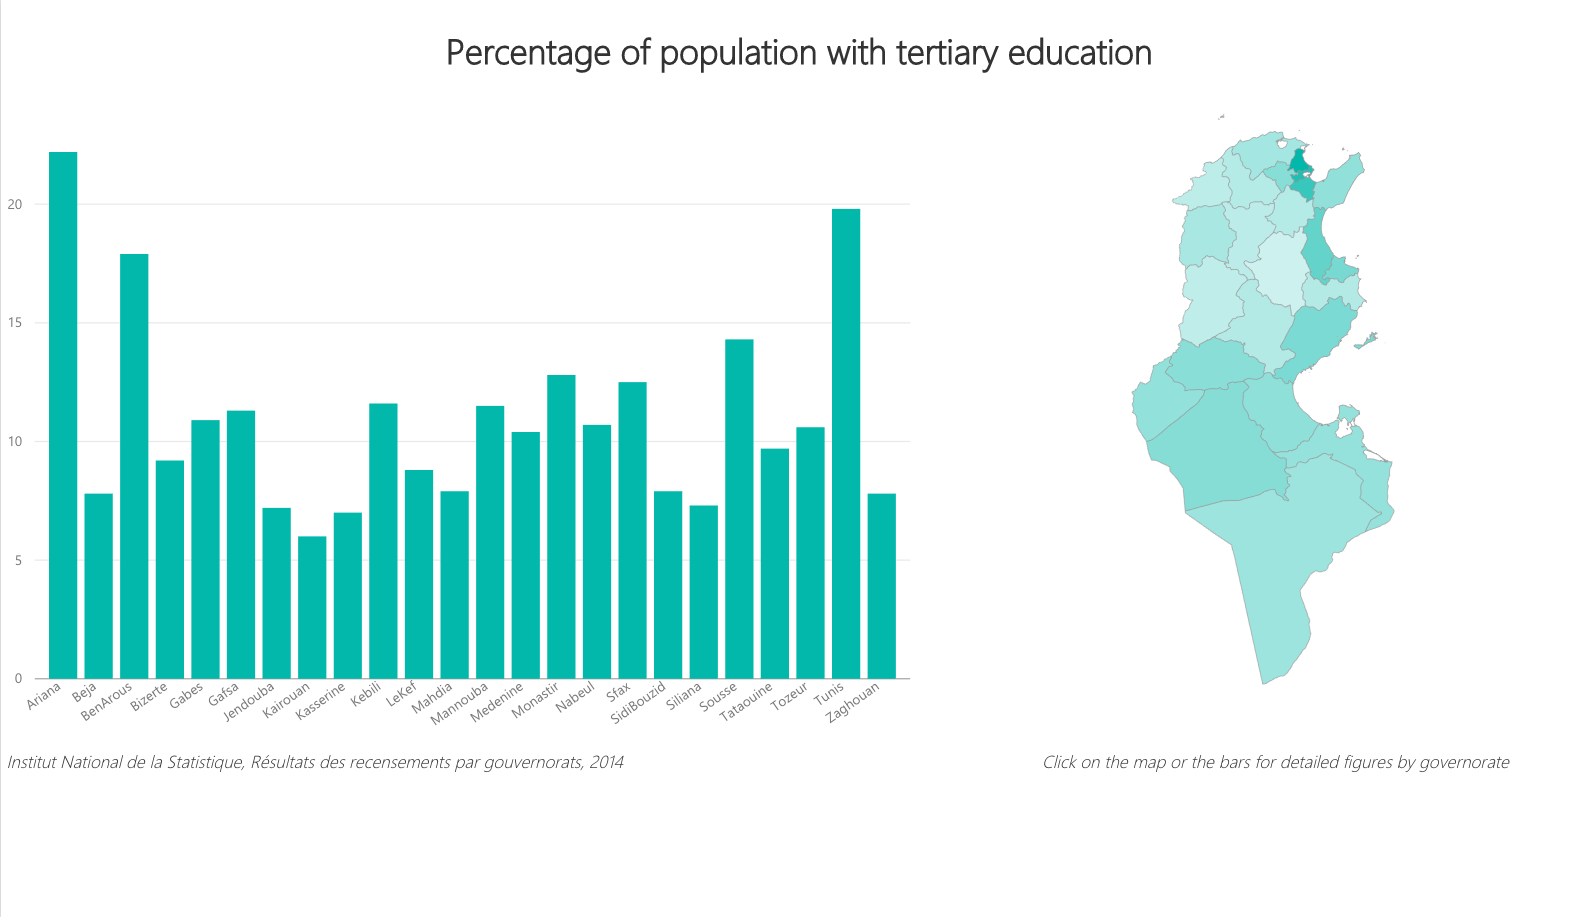
– Percentage of unemployed population older than 15 years 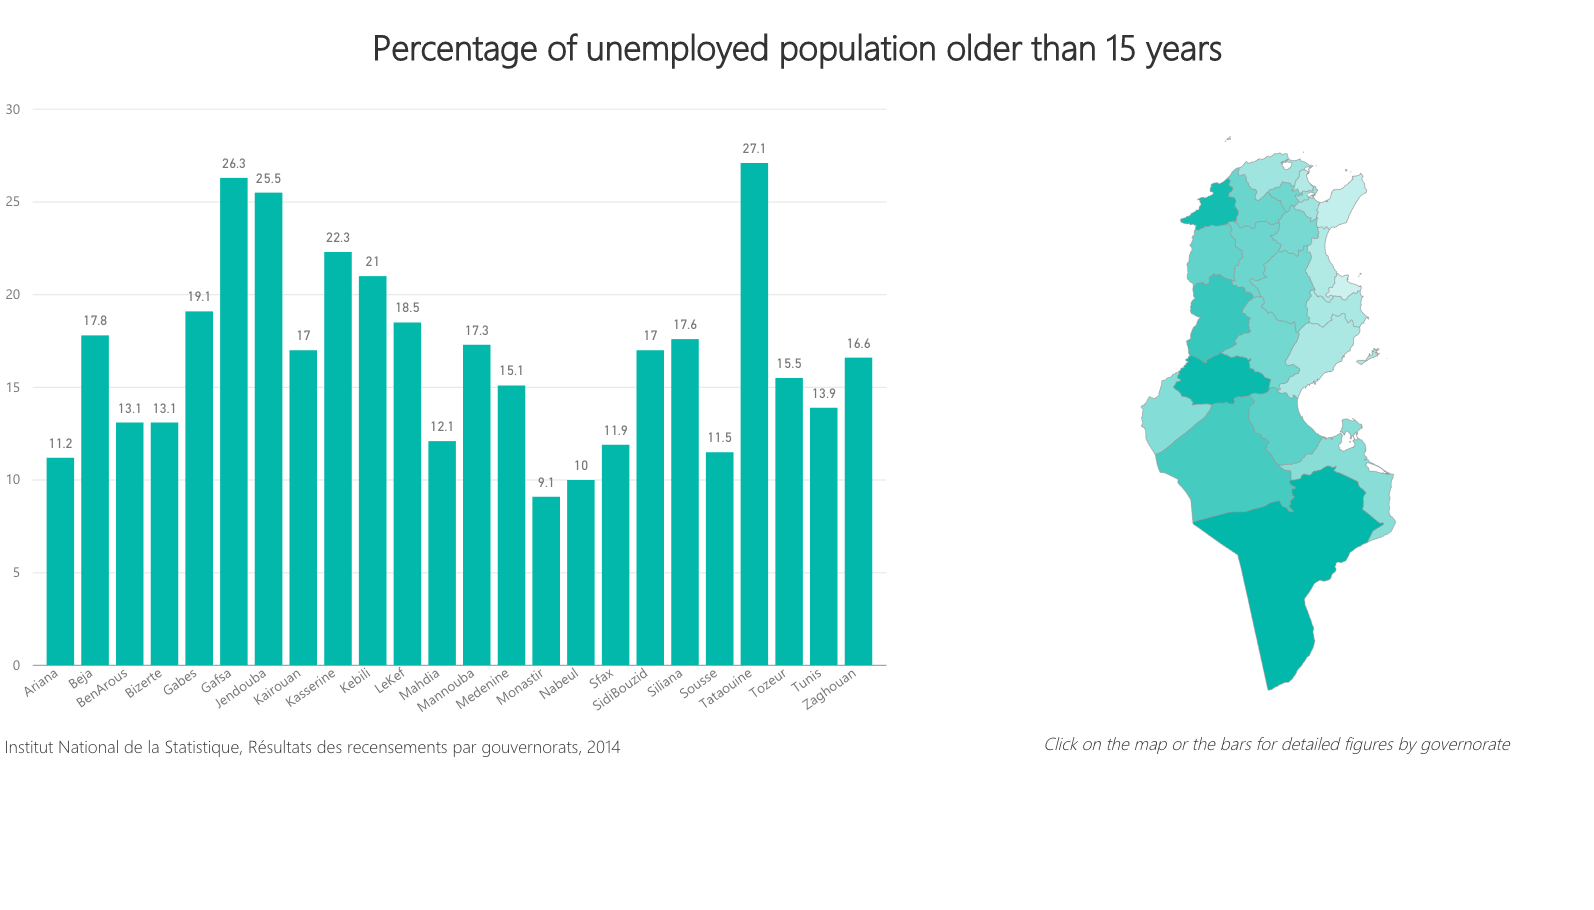
– Percentage of unemployed population older than 15 years with a tertiary education diploma 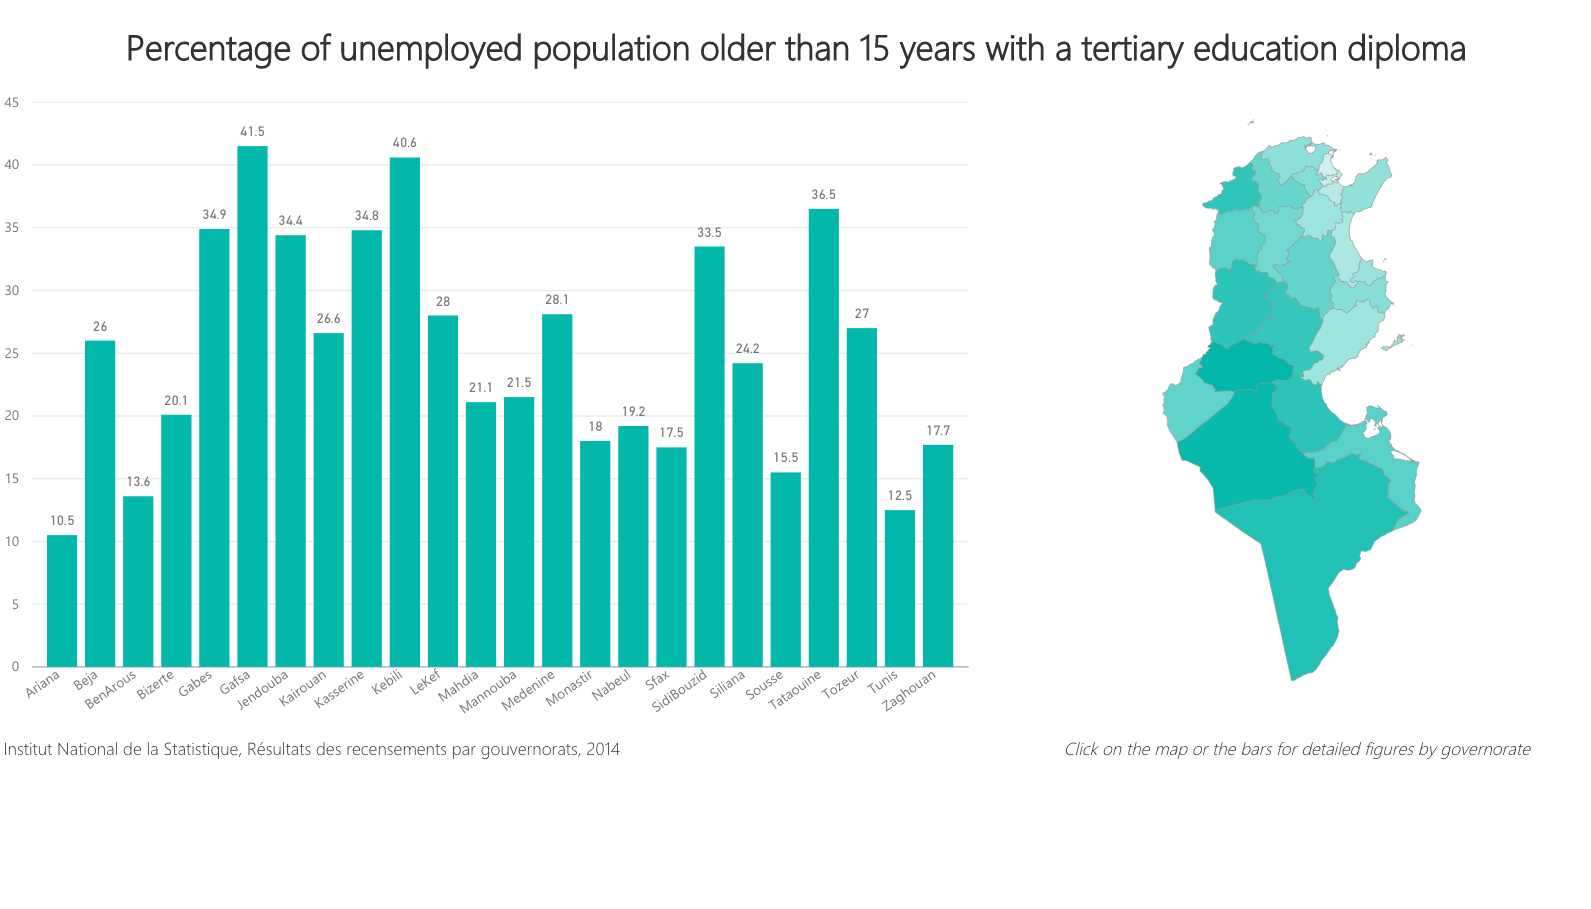
– Female activity rate (older than 15) .png)

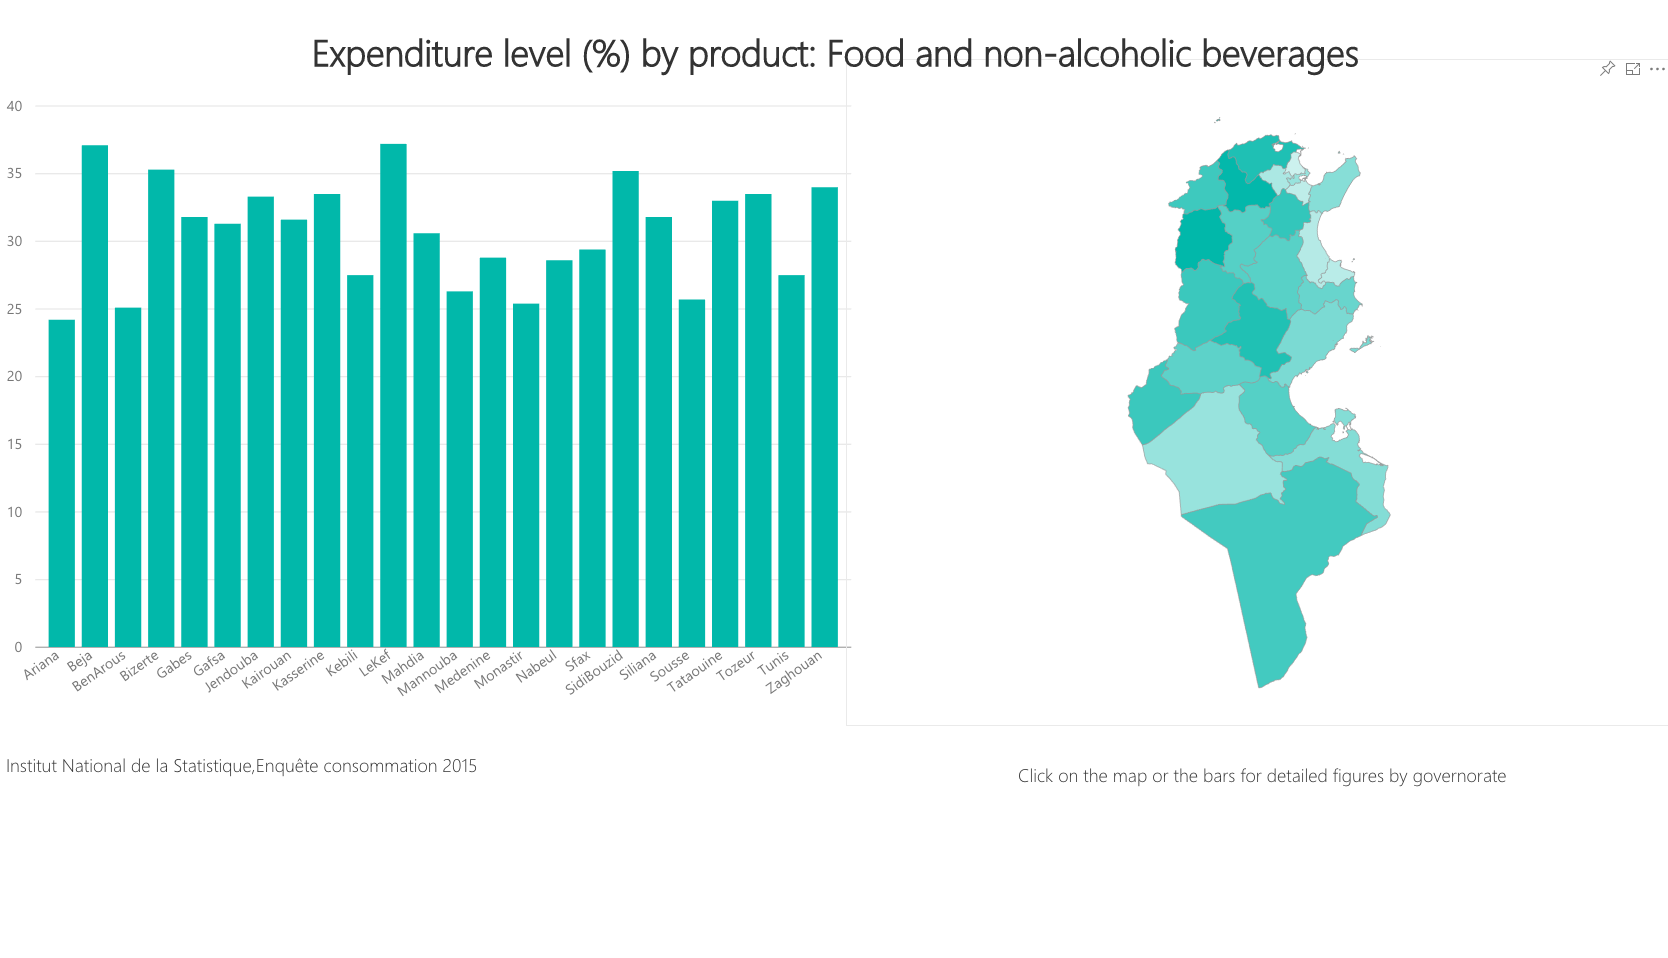
– Expenditure level (%) by product: Food and non-alcoholic beverages